
Paradigm Shift Intervention Monitoring
 twitter

Commentary
CDC Adds H3N2v
Column In Week 33 FluView
Recombinomics
Commentary 16:15
August 30, 2012
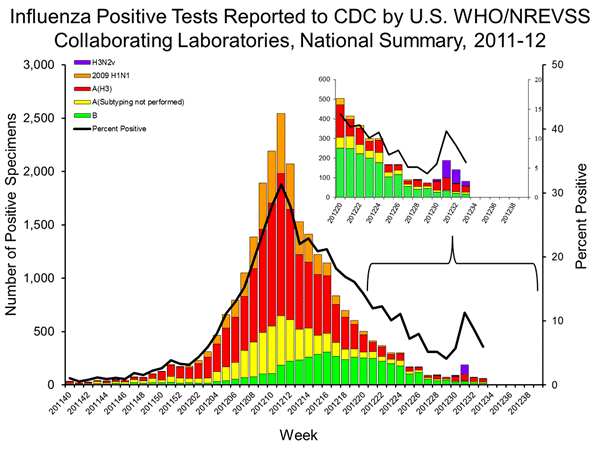
The above figure is from the CDC week 33 FluView as the CDC prepares to pivot to H3N2v community transmission. The numbers listed are fluid (as seen in the differences in the above figure which shows a different distribution for H3N2v cases in the expanded view of weeks 20-33). However, the above figure also has a table, which has a column for H3N2v added in week 33.
The table has the first H3N2v case in week 28 which corresponds to the Hawaii case (A/Hawaii/03/2012). It does not include earlier cases, including the first case in 2012, A/Utah/10/2012, or the two confirmed cases in West Virginia in late 2011 (A/West Virgina/06/2011 and A/West Virginia/07/2011), which were associated with 22 additional ILI cases who were contacts of the index. Similarly, the figure and table do not include the Iowa cluster (A/Iowa/07/2011, A/Iowa/08/2011, A/Iowa/09/2011), which like the cluster in West Virginia, did not involve swine exposure. Also excluded were the two cases in Maine (A/Maine/06/2011 and A/Maine/07/2011), and the second case in Indiana (A/Indiana/10/2011) all of which were reported in the 2011/2012 season.
The CDC inclusion of an H3N2v column in its week 33 FluView is an added data set. However, the CDC documents create considerable confusion since they use multiple definitions for the evolving H3N2v, which was first reported in the United States in the summer of 2009 (A/Kansas/13/2009). The first case with an H1N1pdm09 M gene was in July, 2011 (A/Indiana/08/2011), and that sub-clade was found in the following 9 cases, ending with the Iowa cluster.
All sequences since the Iowa cluster have been from a novel sub-clade which acquired an N2 gene with a lineage found in H3N2v swine (in contrast to the first 10 cases in 2011, which had an N2 with a lineage found in H1N2v swine).
The CDC has released 34 sets of sequences from July and August isolates, which are from the cases represented in the above figure and associated table. All represent a clonal expansion of a sub-clade found in recent human cases in Hawaii, Indiana, Ohio, Maryland, Minnesota, Pennsylvania, and Wisconsin. All of these sequences are closely related to each other an fall on the same branch in phylogenetic analysis for all 8 gene segments. 7 of the 8 branches are rooted in the West Virginia sequences, while the 8th branch (MP) is rooted in closely related sequences from swine isolates which are from the sub-clade found in the first ten 2011 cases.
The numbers listed in the CDC FluView are largely dependent on testing, which is heavily focuses on swine exposure cases. Moreover, only a sub-set of such cases are listed in the table. At the Gallia County Fair, there were hundreds of cases. 200 of the ILI attendees were tested with a rapid test, and 60 were influenza A positive, indicating virtually all of the ILI cases were infected with influenza A and further testing of a subset initially identified 11 H3N2v cases, which are represented in the table. However, further testing of the samples collected from the ILI cases in Gallia County would have identified more than 180 additional cases at that location.
The large clusters at fairs, coupled with the sequence data, which signals clonal expansion, supports efficient and sustained human transmission, CDC representations notwithstanding.
Recombinomics
Presentations
Recombinomics
Publications
Recombinomics
Paper
at Nature Precedings